
Edmonton
November 2013 Edmonton Real Estate Statistic

March 2013 Edmonton Real Estate Statistic

February 2013 Edmonton Real Estate Statistic

January 2013 Edmonton Real Estate Statistic

November 2012 Edmonton Real Estate Statistic

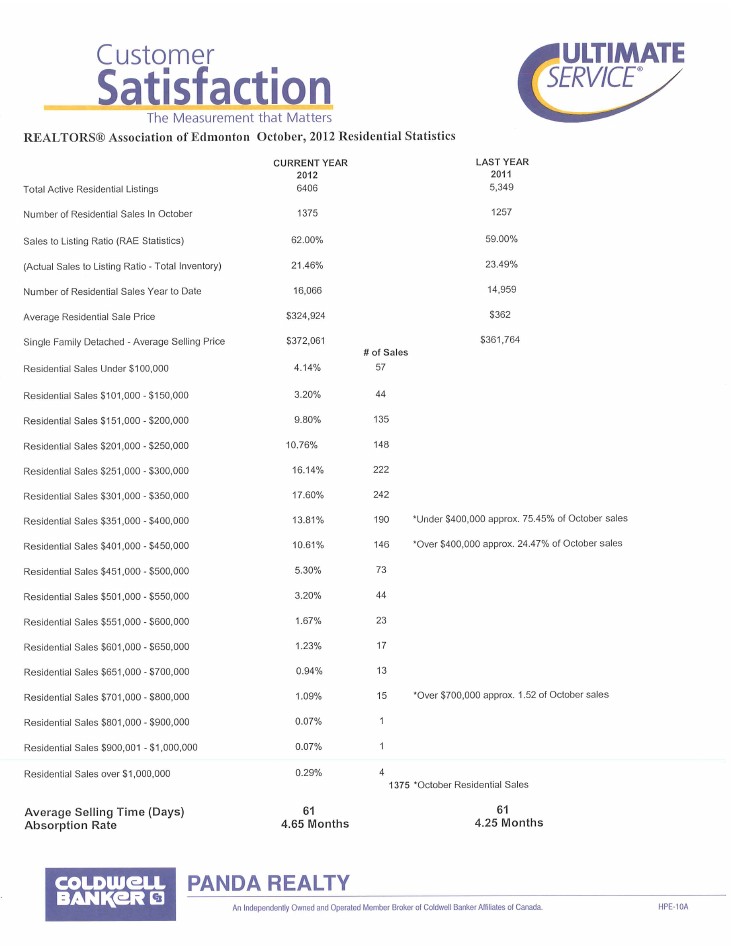
October 2012 Edmonton Real Estate Statistic
January 2012 Edmonton Real Estate Statistic
March 2013 Edmonton Real Estate Statistic
February 2013 Edmonton Real Estate Statistic
January 2013 Edmonton Real Estate Statistic
November 2012 Edmonton Real Estate Statistic

Decemeber 2011
November RAE stats

Information provided by
Sherry Belcourt
Darby (Click here to contact
agent)
Coldwell Banker Panda
Realty
November 2011

September 2011

Information provided by
Sherry Belcourt Darby (Click here to contact agent)
Coldwell Banker Panda Realty
May 2011

Information provided by
Sherry Belcourt Darby (Click here to contact agent)
Coldwell Banker Panda Realty
Information provided by
Sherry Belcourt Darby (Click here to contact agent)
Coldwell Banker Panda Realty
| REALTORS® Association of Edmonton June, 2010 Residential Statistics | ||||||||||
| CURRENT YEAR | LAST YEAR | |||||||||
| 2010 | 2009 | |||||||||
| Total Active Residential Listings | 9406 | 6,785 | ||||||||
| Number of Residential Sales in June | 1539 | 2448 | ||||||||
| Sales to Listing Ration (RAE Statistics) | 44% | 77% | ||||||||
| (Actual Sales to Listing Ratio - Total Inventory) | 16.5% | 36% | ||||||||
| Number of Residential Sales Year to Date | 9,120 | 9,800 | ||||||||
| Average Residential Sale Price | $335,397 | $328,299 | ||||||||
| Single Family Detached - Average Selling Price | $391,497 | $370,317 | ||||||||
| # of Sales | ||||||||||
| Residential Sales Under $100,000 | 2.75% | 42 | ||||||||
| Residential Sales $101,000 - $150,000 | 4% | 62 | ||||||||
| Residential Sales $151,000 - $200,000 | 9% | 140 | ||||||||
| Residential Sales $201,000 - $250,000 | 11.25% | 174 | ||||||||
| Residential Sales $251,000 - $300,000 | 16.75% | 258 | ||||||||
| Residential Sales $301,000 - $350,000 | 18.5% | 285 | ||||||||
| Residential Sales $351,000 - $400,000 | 13.75% | 213 | *Under $400,000 approx 76% of June Sales | |||||||
| Residential Sales $401,000 - $450,000 | 8% | 125 | *Over $450,000 approx 15.5% of June Sales | |||||||
| Residential Sales $451,000 - $500,000 | 5% | 80 | ||||||||
| Residential Sales $501,000 - $550,000 | 2.5% | 40 | ||||||||
| Residential Sales $551,000 - $600,000 | 2.5% | 38 | ||||||||
| Residential Sales $601,000 - $650,000 | 1.5% | 25 | ||||||||
| Residential Sales $651,000 - $700,000 | 1% | 15 | ||||||||
| Residential Sales $701,000 - $800,000 | 1.25% | 18 | *Over $700,000 approx 3% of June Sales | |||||||
| Residential Sales $801,000 - $900,000 | 0.50% | 8 | ||||||||
| Residential Sales $900,001 - $1,000,000 | 0.25% | 2 | ||||||||
| Residential Sales over $1,000,000 | 1% | 14 | ||||||||
| 1539 | *June Residential Sales | |||||||||
| Average Selling Time (Days) | 47 | 51 | ||||||||
| Absorption Rate | 6.1 Months | 2.8 Months | ||||||||
Information provided by
Sherry Belcourt Darby (Click here to contact agent)
Coldwell Banker Panda Realty
Information provided by
Sherry Belcourt Darby (Click here to contact agent)
Coldwell Banker Panda Realty
From RBC's Special Report on Housing Affordability across Canada published March 2008:
Calgary & Edmonton - rapid slowdown underway?
The pendulum has swung quite rapidly from a red-hot seller's market to one that is decelerating at a remarkable pace. All home segments witnessed sizeable improvements to affordability conditions in the final quarter of 2007 with momentum expected to continue this year. Sales-to-new listings ratios in both cities continue to decline and still remain in the soft end of a balanced market. Year-over-year house price gains continue to slow sharply dropping in January to 8% in Calgary and 11% in Edmonton. The softness is also evident in the new home market. Housing starts in Calgary have slowed dramatically dropping 33% year-over-year in the final quarter of last year and a further 11% in January. The rapid run-up in house prices has triggered automatic stabilizers to kick-in by aggressively pricing prospective homeowners out of the market. As more supply gradually makes its way to market, the pace of price gains are expected to continue to fall closer in line with income growth and underlying market conditions.


Edmonton Mortgage Carrying Costs

House Prices

Resale Market
Alberta on watch
Nationwide housing affordability deteriorated in every consecutive quarter throughout 2007 to end up at its most unaffordable level since the housing bubble peaked in 1990. Back then, soaring interest rates and a recession sparked much of the trouble. Today, however, a long upward trend in house prices driven by sounder macroeconomic fundamentals like job growth is primarily responsible. Adding more fuel to this housing cycle is mortgage product innovation that has expanded the market to more potential buyers since mortgage insurance liberalization began two years ago.
Only Alberta bucked the trend in the latest quarter. Outside of Alberta, affordability deteriorated in every single market and for each type of housing.
The lagged effects of higher fixed mortgage rates continue to be a significant part of deteriorating affordability, but our forecast sees the popular five year mortgage rate dropping by a further 75 basis points by year-end. Going forward, falling mortgage rates, cooler forecast house price gains and decent income growth should all lead to improved affordability across most markets.
It's premature to get too concerned, but Alberta's housing market is on watch for possible further negative developments. The average price of a standard twostorey home fell by 4.3% last quarter over the previous quarter. Bungalow prices fell by 7.3%, townhomes were off by 4% and condos fell by 5.3% in their second consecutive quarterly dip. The price of the benchmark two-storey home is still 63% higher than two years ago, and one quarter does not make a trend. However,
the year-over-year pace of price gains has gone from about 50% a year ago to only 11% today. Furthermore, the sales to listing ratios in Calgary and Edmonton remain at about 0.4, or about half the peak recorded over the past two years, which points to the risk of further price cooling in a market with more slack.
The arrival of slipping house prices in Alberta may well enhance a growing tendency to make comparisons between Canadian and U.S. household finances. Americans are still modestly richer, but much more heavily leveraged and further indebted with less liquidity (see table). That, in turn, makes them more vulnerable to ongoing credit market turmoil and risks to house prices than Canadians.
The sharp depreciation in the U.S. dollar over the past six years has made Canadians relatively much richer over time by raising the relative value of what their wealth will buy in world markets compared to Americans. The table uses figures in local currency terms and a C$ floating around parity makes for fairly direct comparisons. If, however, this were six years ago when the C$ bottomed out at 62 cents against the greenback, then Canadian household net worth would be over 40% lower than in the United States. Even if a long-run average C$ value say, 85 cents) were assumed, Canadian household net worth is still relatively much higher than years past.

Alberta's housing markets on watch
Affordability appears to have peaked about midway through last year. Conditions are now already on an improving track with more relief in the pipelines over the coming quarters. Healthy income gains (running at 5% year-over-year in the final quarter of 2007) combined with a decline in house prices led to overall affordability improvements for new homeowners trying to tap into the overvalued Alberta market. This marks the first time in over three years that the market has witnessed a broad-based affordability improvement across all home segments. This also marks the start of what we fear could become a trend. All of the key housing measures are in contraction mode right now including house prices, housing starts, and resale activity. The sales-to-new listings ratio has swung dramatically from deep seller's territory into a more balanced state and has remained in steady balance for the last six months. Further improvements are expected as the market continues unwinding and mortgage rate relief materializes.
October 2007
Is the pendulum starting to swing the other way? It may be... For the last while we've been comparing the market to a pendulum - it swung way over to one side when prices were escalating rapidly in '06 and the first half of '07. Then it swung way over to the other side when inventory started to drastically rise to an all time high. As time passes it should take smaller swings in each direction and eventually settle down.
As you'll see with the charts below, the pendulum seems to have started its swing in the other direction. Don't get me wrong, we're still seeing a drop in prices, inventory is still high, sales are seasonally low, but things seem to be stabilizing. One thing is for certain, sales have definitely perked up compared to the previous months.

October typically has lower sales than September, but as you can see sales in October picked up substantially from previous months to a level similar to 2003-2005.
Of course, everyone wants to know what happened to prices so I won't draw this out:

Average prices went up from $344286 in September to $347668 in October! Now, don't get too excited, the average price for single family homes went down for the 5th month in a row. Condos have been keeping the overall average up while single family prices have declined (more on this tomorrow).
We also saw inventory drop for the first time since February. We were starting to wonder if it would ever drop!

Sales increased, but expiries, cancellations and terminations also contributed to the drop in inventory (more on this later in the week).
All these factors have pushed the market more towards a more balanced market:

Information provided by
Sara MacLennan (Click here to contact agent)
and
Sheldon Johnston (Click here to contact agent)
September 2007
Edmonton Market Update
The market in Edmonton is slow. It takes 43 days to sell a listing now compare to 23 days in 2006. It's currently over 10,000 listings compare to 1200 in 2006 in MLS system. Price has rowed back between 7% & 8 % compare to May 2007. New home builder is throwing in new car - Toyota and all GST rebate to attract buyers. It will probably last till the end of 2007. There were 1100 sales in Sept 2007 compare to 2000 sales in 2006.
For the condo market in Edmonton, Hi-rise is more of the life style vs price point. The high concentration of hi-rise condos only locate in downtown area with age & pets by-law restriction. The empty nester, single and young professional buyers are the target audience. Price range between $200's & $600's. Less than 10% sales are over $500,000. We do have a lot of inventeory due to the lately conversion from rental. Lots of the non concrete construction walk up 4 storeys wood frame buildings are now available. The town house that was built in the 70's and 80's (row house) are also propular because of the price range between $250,000 & $320,000 with less bylaw restriction.The immigration market is a lot less than 15 yr ago however, the Mainland Chinese buyers are still dominating the market. They are the graduates from the University and the professional immigrants landed with professi
onal immigration status. Chinese investors is another factor from all origin. Rental market is in high demand. Some areas are less than 1% vancancy rate. Percentage of Asian market is around 10% or less. Average single family house as of Sept 07 is still approximately $399000 which is very reasonable.
Information provided by
Wilson Lam (Click here to contact agent)
Coldwell Banker Panda Realty


